
1. Valuations
First, there is a big difference in valuation between today and the past bubble period. The forward PE multiple of stocks in the First Section of the Tokyo Stock Exchange is about 25 times as of 13th April 2021. At the end of December 1989, it was over 60 times. Similarly, the Price to Book ratio is about 1.4 times as of 13th April 2021. But it was more than 5 times at the end of 1989. The market today is nowhere near as expensive as that of 1989.
Also, during the bubble era, the term "Q ratio" was coined to justify high valuations. The "Q ratio" is called the real price-to-book ratio, and the enterprise value is calculated based on the market value of assets including land, buildings, machinery and securities owned by the company, and is compared with the prevailing share price. In other words, if the value of land or securities rises, the fair share price will be calculated by taking into account unrealized gains. Furthermore, the method was devised to justify the stock price by incorporating future asset price increases such as land property. Today, there is no sense that stocks are overpriced and it requires no justification by using such extreme measures.
Looking at the top stocks by market capitalization in the First Section of the Tokyo Stock Exchange, you can see that there has been a shift in the industrial structure, which is very different from the bubble period. In 1989, NTT, the Industrial Bank of Japan (currently Mizuho Financial Group), and Sumitomo Bank (currently Sumitomo Mitsui Financial Group) were the top 3 companies by capitalization, and 6 of the top 10 companies were banks. On the other hand, as of April 2021, Toyota Motor, Sony, SoftBank Group and Keyence are the top companies. While the industrial structure was dominated by domestic demand and financial names during the bubble era, the lineup today includes blue chip global companies which are world leaders in name and reality.
2. Corporate fundamentals
There has been a major change in corporate fundamentals since the bubble era.
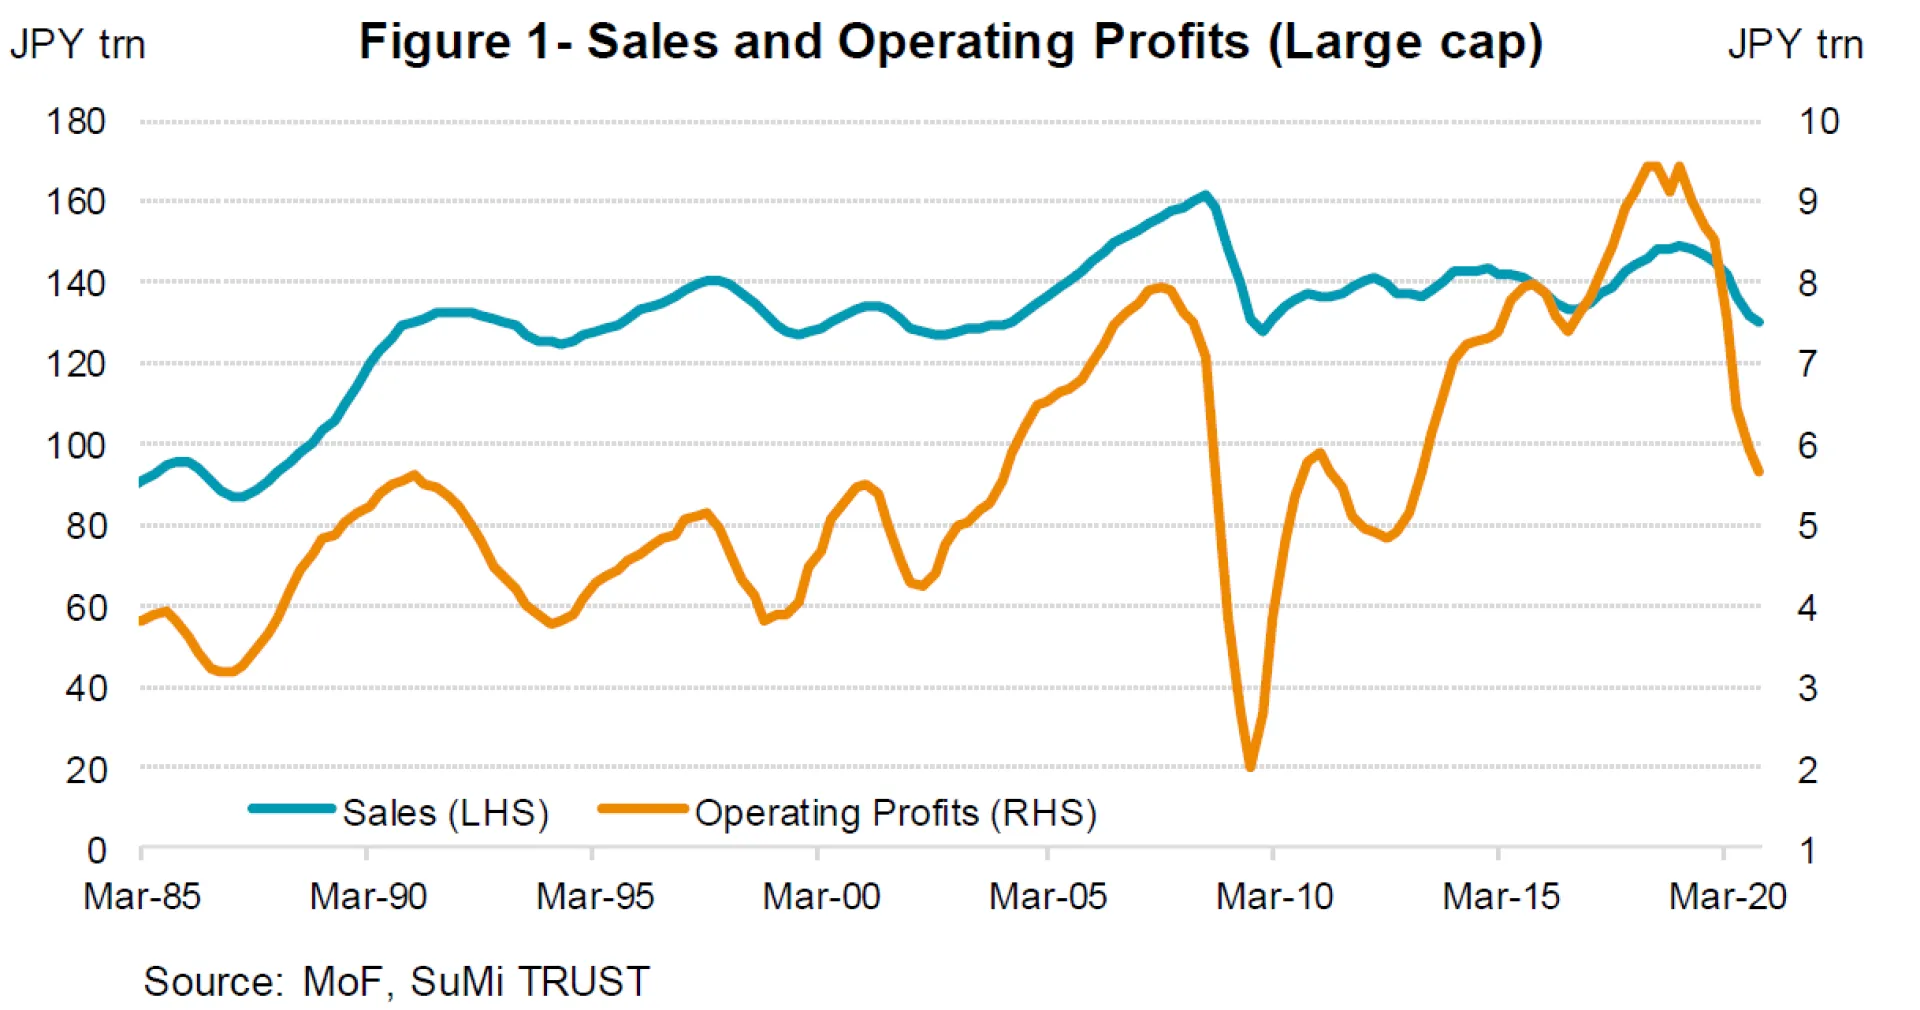
Looking at aggregate operating income of large companies, it increased to 8.5 trillion yen in the October- December 2019 quarter, just before COVID-19, or 1.5 times the peak period during the bubble economy. Although it fell significantly in the April-June 2020 quarter due to the pandemic, it is still about the same as at peak levels during the bubble economy.
Looking at the financials of companies, sales continued to grow steadily during the bubble period, and operating income also increased alongside sales, but peaked out in 1990, two years ahead of sales. Due to the overconfidence stemming from consistent growth in sales, it is possible that management neglected efforts to boost profitability.
However, looking at subsequent developments, while sales have remained almost flat since 1995, operating income has increased sharply from 2010 to 2019, and profitability continues to improve steadily (Figure1). The results of corporate efforts such as cost reduction, productivity improvement, and emphasis on added value began to bear fruit, suggesting that corporate earnings can better withstand external pressures as compared to the bubble period.
Also, looking at the soundness of the company's balance sheet and financials, today’s landscape is significantly different from the bubble period.
During the bubble era, there was a clear move by companies to overinvest, mainly due to overly optimistic expectations that demand would continue to grow forever. According to the Cabinet Office, the potential economic growth rate of Japan was +3.6% in 1990, and the average growth in annual capital investment from 1987 to 1990 was +11% (Figure2). However in reality, the potential economic growth rate of Japan slowed to +1.8% in 1993 as we shifted from an era of demographic dividends to demographic burden.
Looking at the relationship between capex and cash flow, it was clear that companies made aggressive capital investments based on excessive optimism for future growth in demand. The cash flow ratio of capital investment reached 130% in 1990 (Figure3). Looking at corporate debt, from 1988 to 1992, long-term borrowings to finance such capital investments surged.
But, by nature, debt is nothing more than borrowing with future earnings as collateral. Unless demand grows as expected, investments cannot be recovered and the result brings excessive equipment and debt. After all, after the bubble burst, eliminating excess capacity and debt had become the major issue for companies. Long and extended balance sheet adjustments were the major cause of the long-term economic stagnation, often referred to as the "lost 20 years", as land prices plummeted.
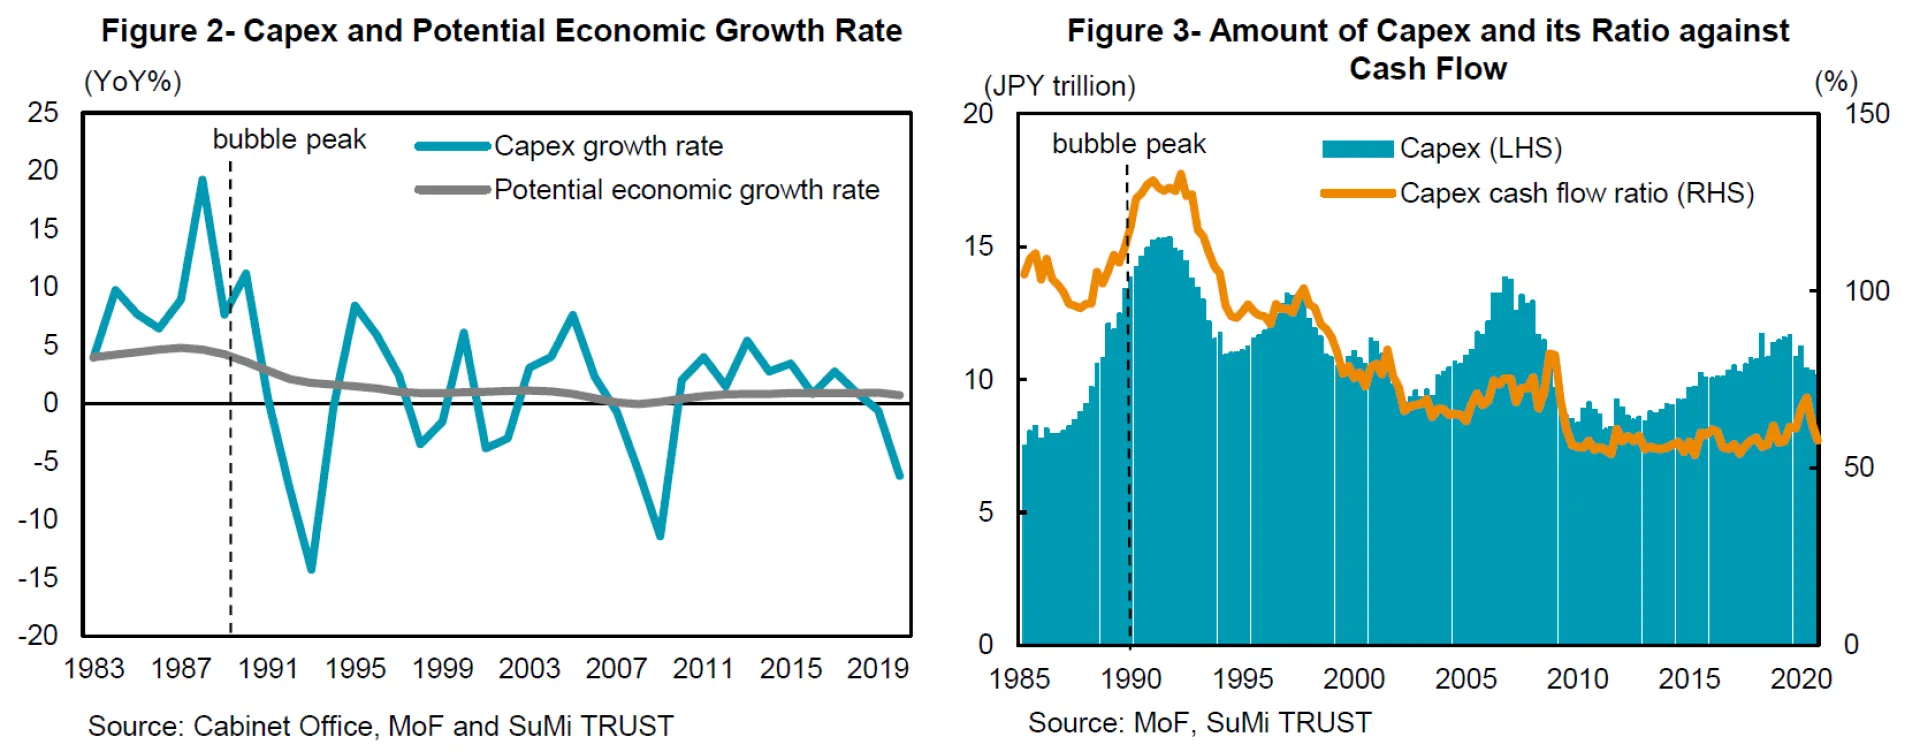
On the other hand, this time, at least from a macroeconomic perspective, there is no noticeable excess of capex. Since 2010, capital investment has not been excessive, and the capital investment to cash flow ratio has been kept low at around 60%. Before the bubble era and the Lehman shock (the Subprime crisis), capital investment rose to excessive levels against the backdrop of optimistic economic expectations, but then it plummeted. Learning from such bitter experiences, companies have been making more secure capital investments in recent years based on realistic growth expectations.
In terms of content, the main investment objectives have been the introduction of capital equipment to replace labor input, which has become increasingly scarce, and the maintenance and replacement of aging machinery due to underinvestment after the bursting of the bubble economy. In the future, we expect that capital investment will center not in high risk areas such as real estate and construction, where price rose significantly during the bubble period, but on digitalization and environment related investments that enhance Japan's structural growth potential. The risk that Japanese companies would be forced to make significant balance sheet adjustments in the future will be fairly low.
3. Monetary policy
On monetary policy, there is a big difference between today’s policies and that of the past bubble period.
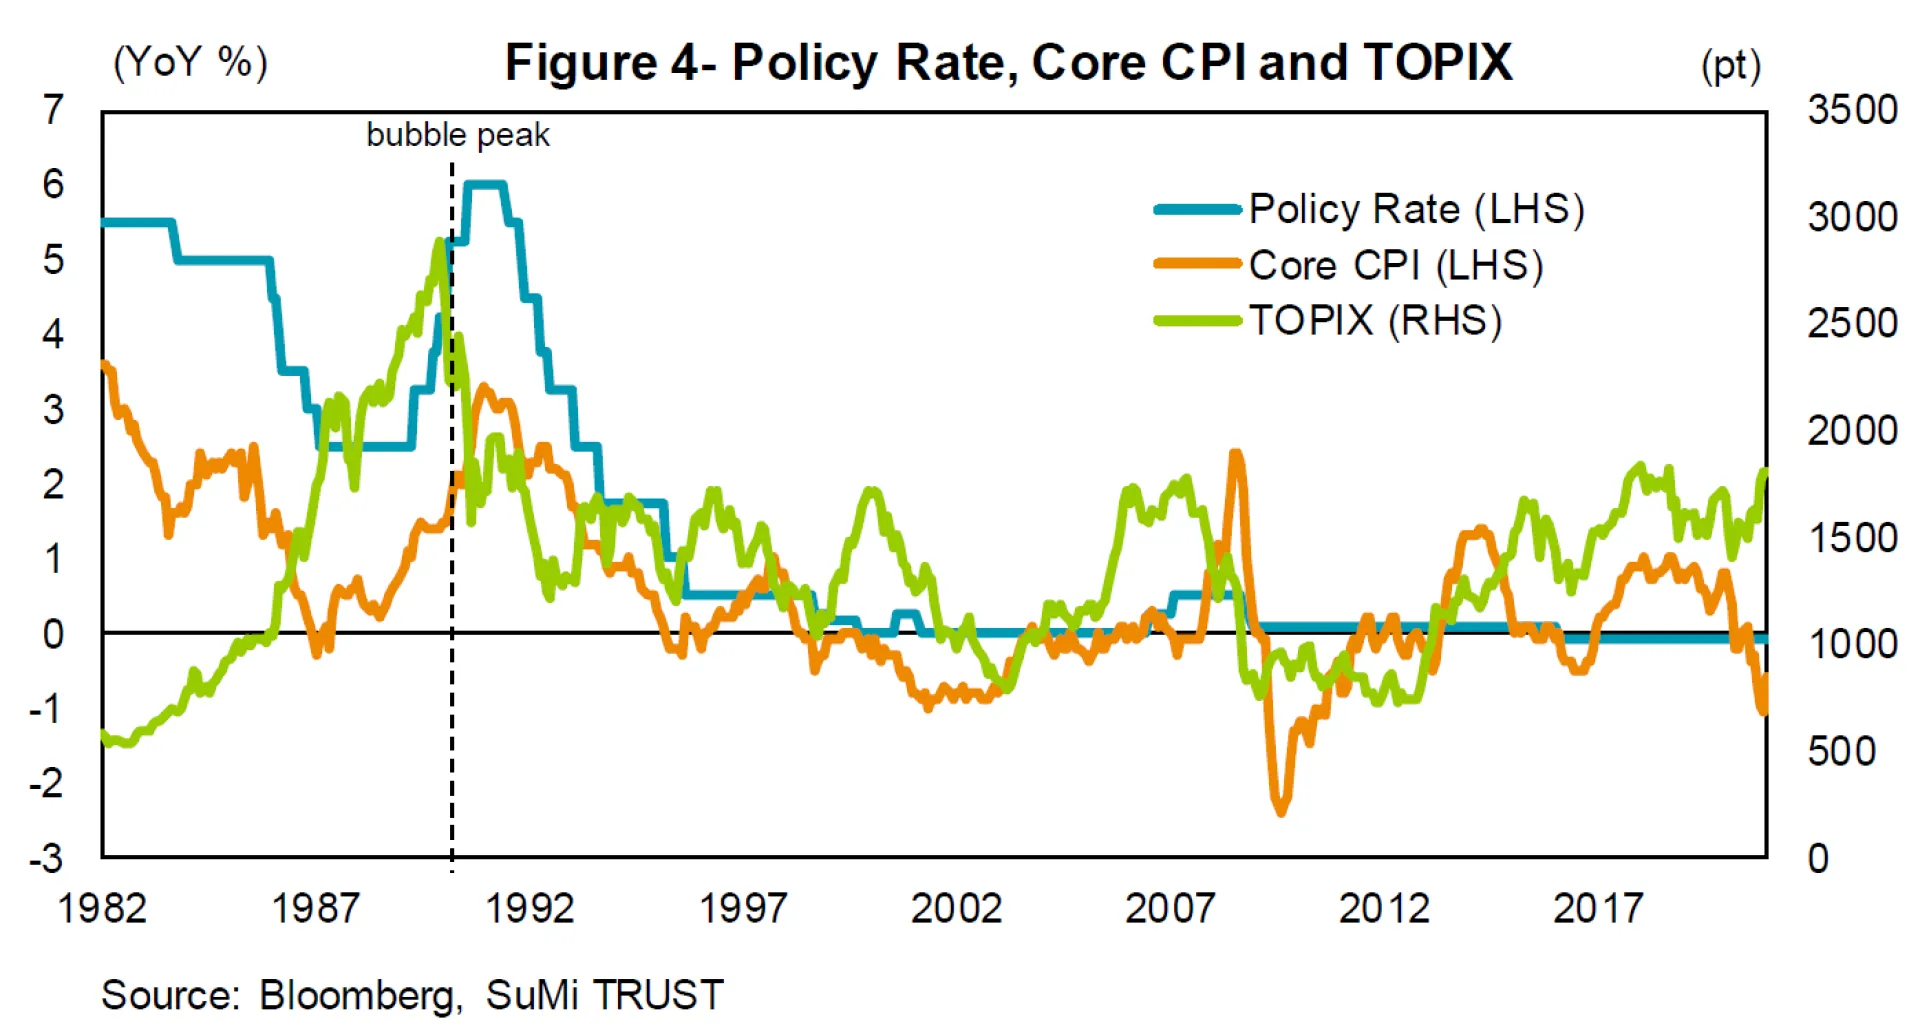
Looking back at the bubble era, the Bank of Japan began tightening after May 1989 and raised the official discount rate three times against the backdrop of a public uproar against soaring land prices. In 1990, the Ministry of Finance implemented a clear policy to "crush the bubble" against the background of public opinion, and introduced comprehensive measures on real estate (a measure to curb loans to the real estate market). This led to a sharp rise in interest rates, which led to the subsequent bursting of the bubble (Figure4).
Today, as part of an accommodative monetary policy, the Bank of Japan is implementing a negative interest rate policy to limit long-term interest rates to around 0%. While setting a 2% inflation target, which is extremely difficult to achieve, the core CPI currently remains in negative territory, and the timing of a normalization of monetary policy remains uncertain. Furthermore, the purchase of ETFs is seen as a policy that supports stock prices. Thus, the direction of policy is completely different from that of 1989, when the government tried frantically to crush the "private sector bubble."
4. Outlook on Japanese Equities
As mentioned above, the current situation is significantly different from the bubble era from multiple angles, and we believe the current Japanese stock market is far from being in a bubble. According to rules of thumb, Japan has been regarded as a cyclical market, and it is reasonable for Japanese market to outperform other markets during recovery phase of the global economy.
The outlook for the Japanese stock market is expected to remain firm as economic activity normalizes with the introduction of the vaccine while accommodative monetary policy and expansionary fiscal policy continue to be carried out around the world. We expect the market will gradually begin to discount a post-COVID19 economic recovery on strong corporate performance. In other words, we should see a full-scale performance, or earnings- based market. As the cost structure of companies has improved, it is expected that some companies will achieve record high profits during the economic recovery phase, and stock selection will be a key.
As investment themes, improvement of corporate governance at Japanese companies and policies by the Suga administration (e.g. decarbonization and digitization) will be featured. As touched in the previous report (“Corporate Reforms under COVID-19”), the movement to improve the governance of Japanese companies is accelerating with COVID-19, and further acceleration is expected by the revision of the Corporate Governance Code and the revision of TOPIX. In terms of decarbonization, investors are paying more attention to companies which contributes to utilize hydrogen, and regarding digitization, it is expected to progress in the development of a common personal information platform to improve the operation efficiency of the public sector.